Ableton/Live/UG/29 Audio Effect Reference/38 Spectrum
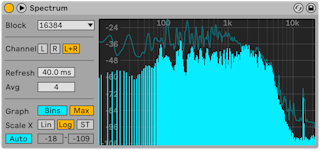
- Spectrum analyzes frequencies in real time and draws level (dB, vertical) against frequency or pitch (horizontal). Peaks stay on the graph until the song restarts. It measures only and never changes the sound.
- Block — samples per measurement; more is more accurate and uses more CPU
- Channel — left, right or both
- Refresh — how often it analyzes; faster is more accurate and uses more CPU
- Avg — how many blocks are averaged per update. 1 shows every block, good for finding short peaks; higher values give a smoother view closer to how we hear.
- Graph — a smooth line or discrete frequency bins
- Max — shows the accumulated maximum; click the display to reset it
- Scale X — linear, logarithmic or semitone. Log and semitone are the same scale with Hz or note names along the top; linear helps when studying the highs.
- Hovering shows level, frequency and note name at the pointer.
- Range/Auto — Range lets you scroll (drag vertically) and zoom (drag horizontally) on the level legend, or set limits with the Range sliders; Auto scales to the input and disables those.
- The title bar button, or double-clicking the display, moves the display into Live's main window.
